Every Carrier Charge, Explained.
Automatically ingests your billing and tracking data and breaks out every accessorial down to the parcel that triggered it. Free for up to 2 million parcels.
Find My Hidden Surcharges — FreeYour Carrier Data, Cleaned and Connected
Messy feeds in. One reliable dataset out. Every week, automatically. Track up to 100,000 newly added parcels every week, up to 2 million total, free. No credit card.
Comprehensive Carrier Data
FedEx, UPS, USPS, and DHL — all connected in one place. Your billing records and delivery data are pulled automatically every week, so you're always working with the freshest information. No manual exports, no chasing carrier portals, no missing data.
Data Cleaning & Normalization
Raw carrier data is deduplicated and normalized across all four carriers into one consistent schema, then enriched with zone, actual weight, billable weight, and full accessorial breakdowns. A UPS charge code and a FedEx charge code finally mean the same thing on the same row
Advanced Analytics & Reporting
Structured data powers our analytics. Understand your true cost-per-pound, benchmark carriers side by side, catch billing discrepancies before they cost you, and make smarter shipping decisions backed by real data.
Accessorial Cost Visibility
The surcharges are a third of your invoice. Now they're a third of your dataset.
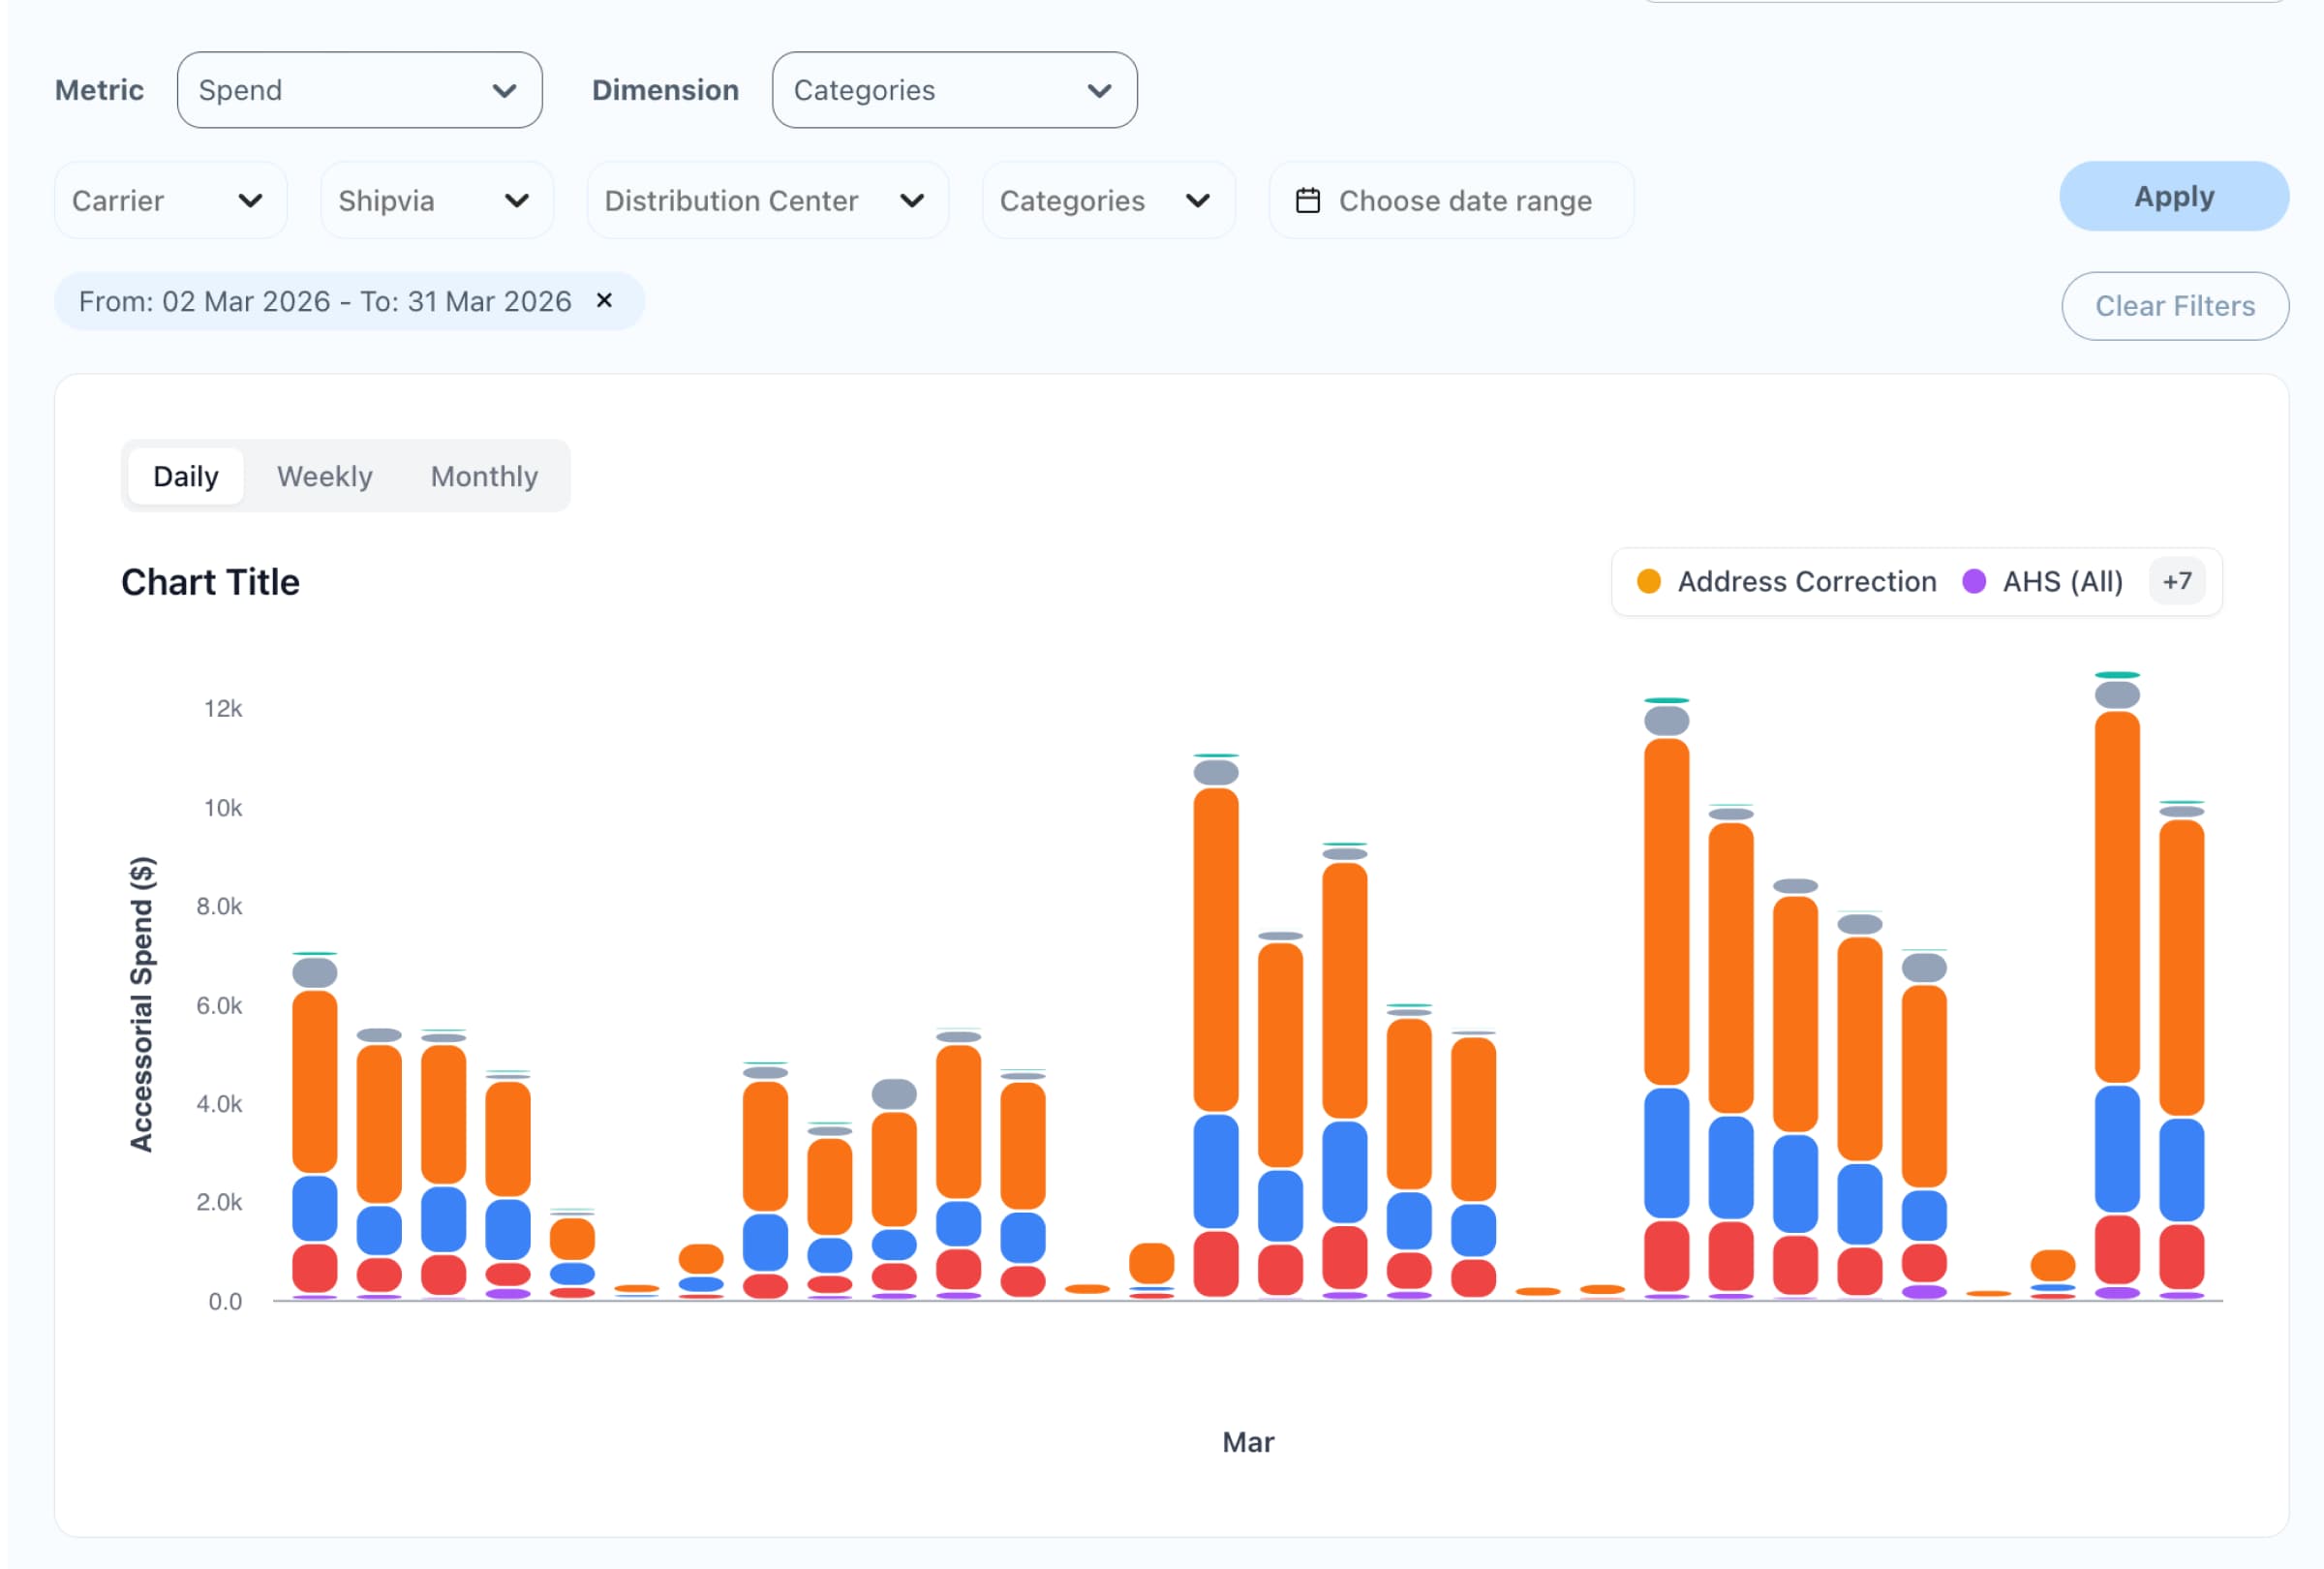
Residential delivery. Delivery area surcharge. Address correction. Additional handling. Every one arrives in a different format, under a different code, from a different carrier — and together they're the single largest uncontrolled line item in most parcel programs.
Full Parcel Surcharge Taxonomy
Every accessorial broken out as its own tracked cost center, not lumped into an "other charges" bucket:
- Delivery-based: Residential Delivery, Delivery Area Surcharge, Extended DAS, Saturday and weekend delivery
- Handling-based: Additional Handling (weight, dimension, packaging), Large Package Surcharge, Oversize and Unauthorized Package
- Correction-based: Address Correction, Delivery Change, Reroute, Redelivery attempts, Return-to-Sender
- Service-based: Signature Required, Adult Signature, Declared Value
- Rate-based: Fuel surcharge, Peak/Demand, Peak Residential, dimensional weight adjustments
Dim-Weight Exposure
Compare actual weight against billable weight across every single shipment. See exactly what dimensional pricing costs you, which box sizes cause it, and how much of your spend is air. This is usually the largest recoverable number on the page — and the one shippers most consistently underestimate.
Charge Attribution
Surcharges don't come from nowhere. Trace every accessorial back to the SKU, box size, ship-from facility, destination ZIP, or customer that generated it — so you fix the packaging or the address validation, not just the invoice.
Spike & Increase Detection
Track accessorial spend as a percentage of total parcel spend over time, and see when a charge type moves outside its normal range. Catches peak-season surcharge windows, and the quiet mid-year additions that never come with an announcement.
Dispute-Ready Export
Filter to any charge type, date range, or carrier and export tracking-number-level detail. Every improper charge and discrepancy comes out as a row you can hand to your rep — or bring to your next negotiation, where accessorial discounts are very much on the table.
Clear Parcel-Level Analytics
Getting insight from your shipping data shouldn't require a data team.
Analyze carrier and cost performance across time, weight, zone, and geography.
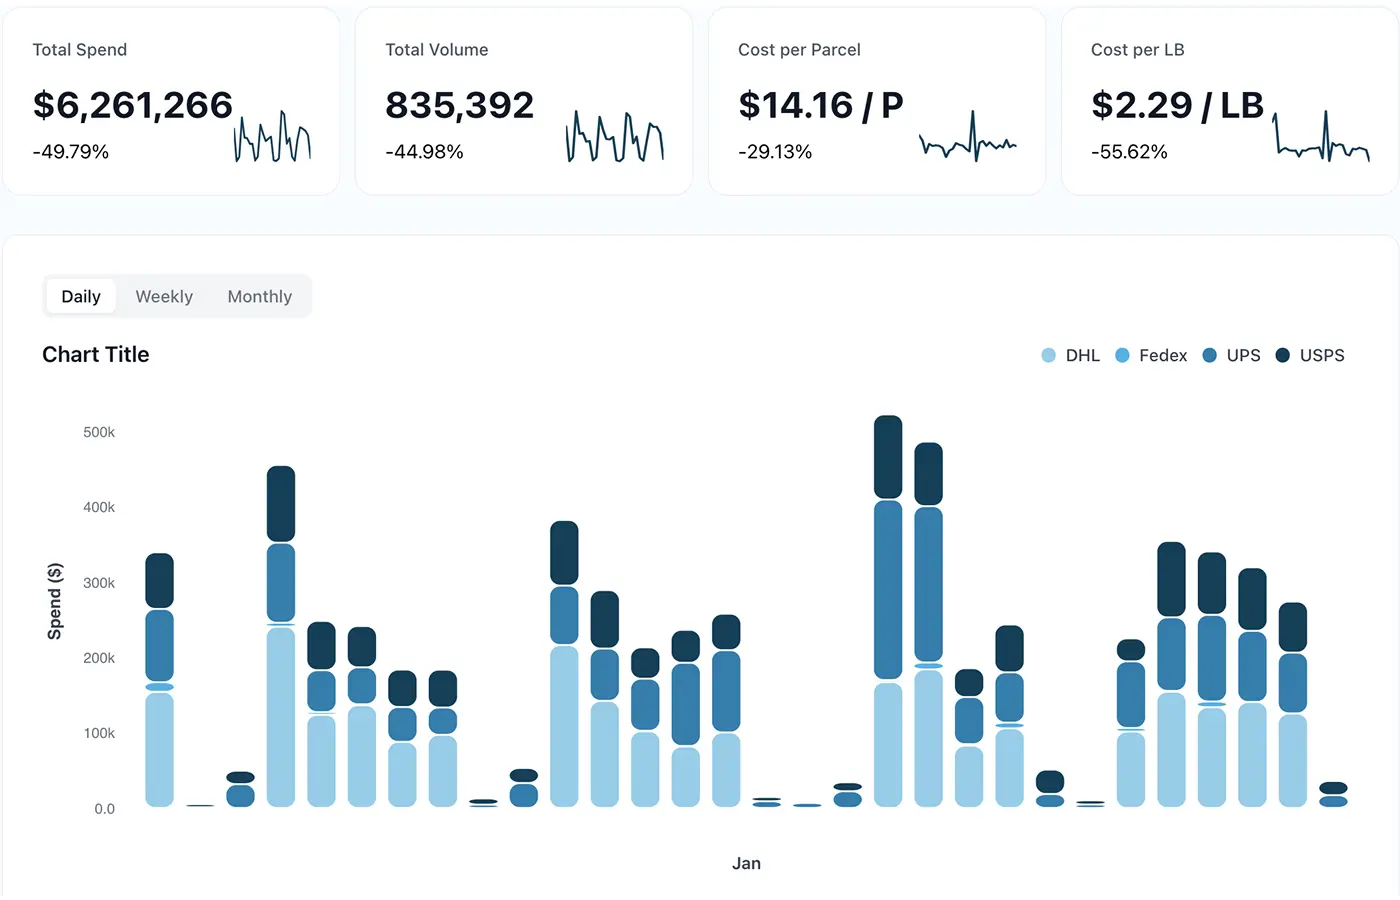
Strategic Trend Monitoring
Know whether this month is normal before the quarter ends.
Comprehensive time-series tracking across your entire carrier mix and every service level. Monitor total spend, volume, and cost-per-pound to identify seasonal patterns, detect sudden cost spikes, and measure whether a rate change actually delivered what your rep promised.
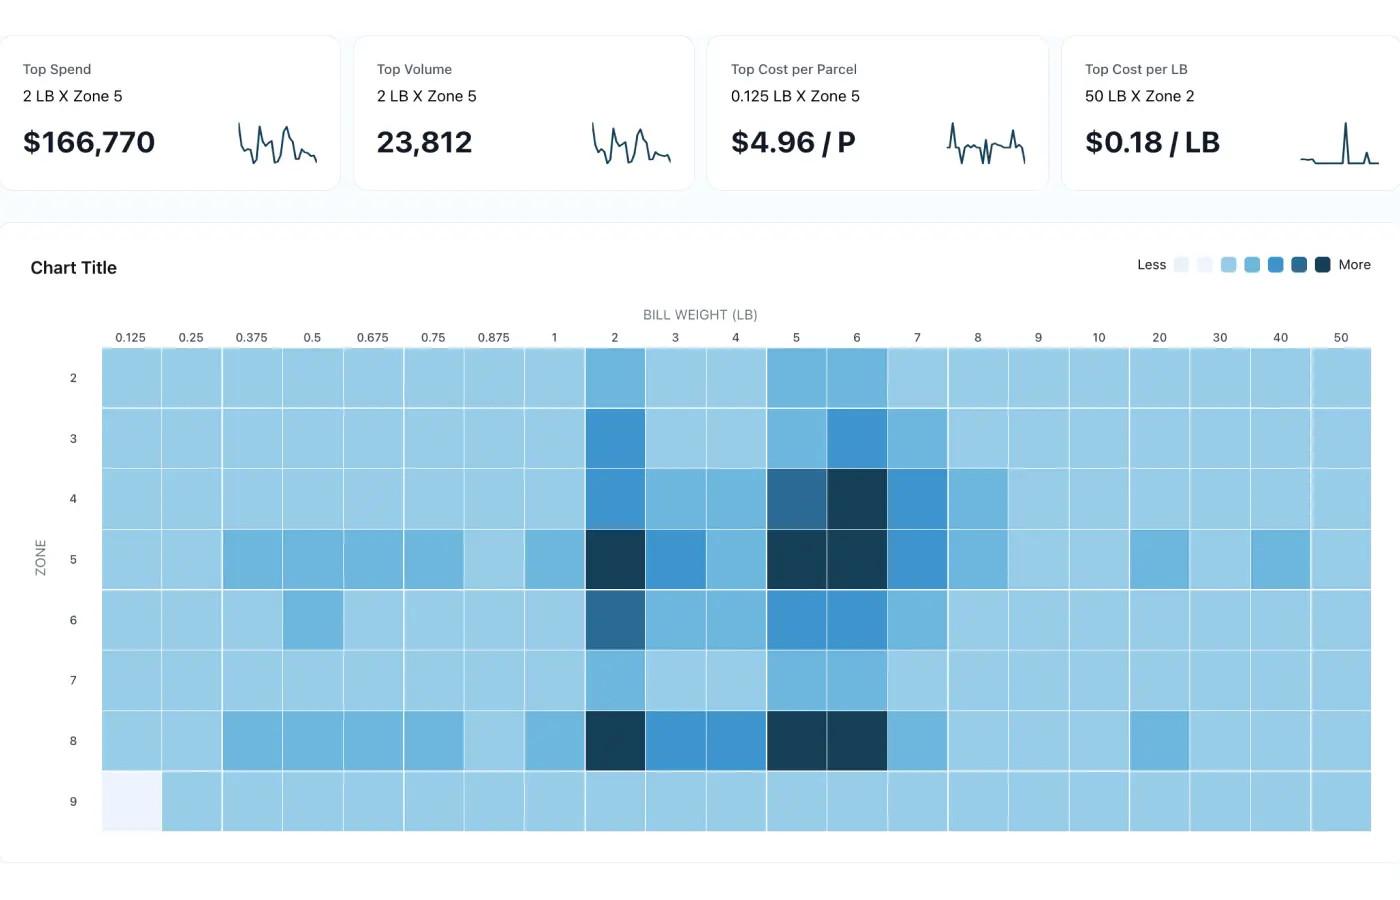
Dimensional & Density Mapping
Find out where your shipping profile makes money and where it leaks.
A matrix analysis of spend and volume by weight versus zone, revealing exactly which combinations are cost-effective and which aren't. Use it to optimize distribution footprint, adjust packaging strategy, and identify the sweet spots for specific carrier-ship-via combinations.
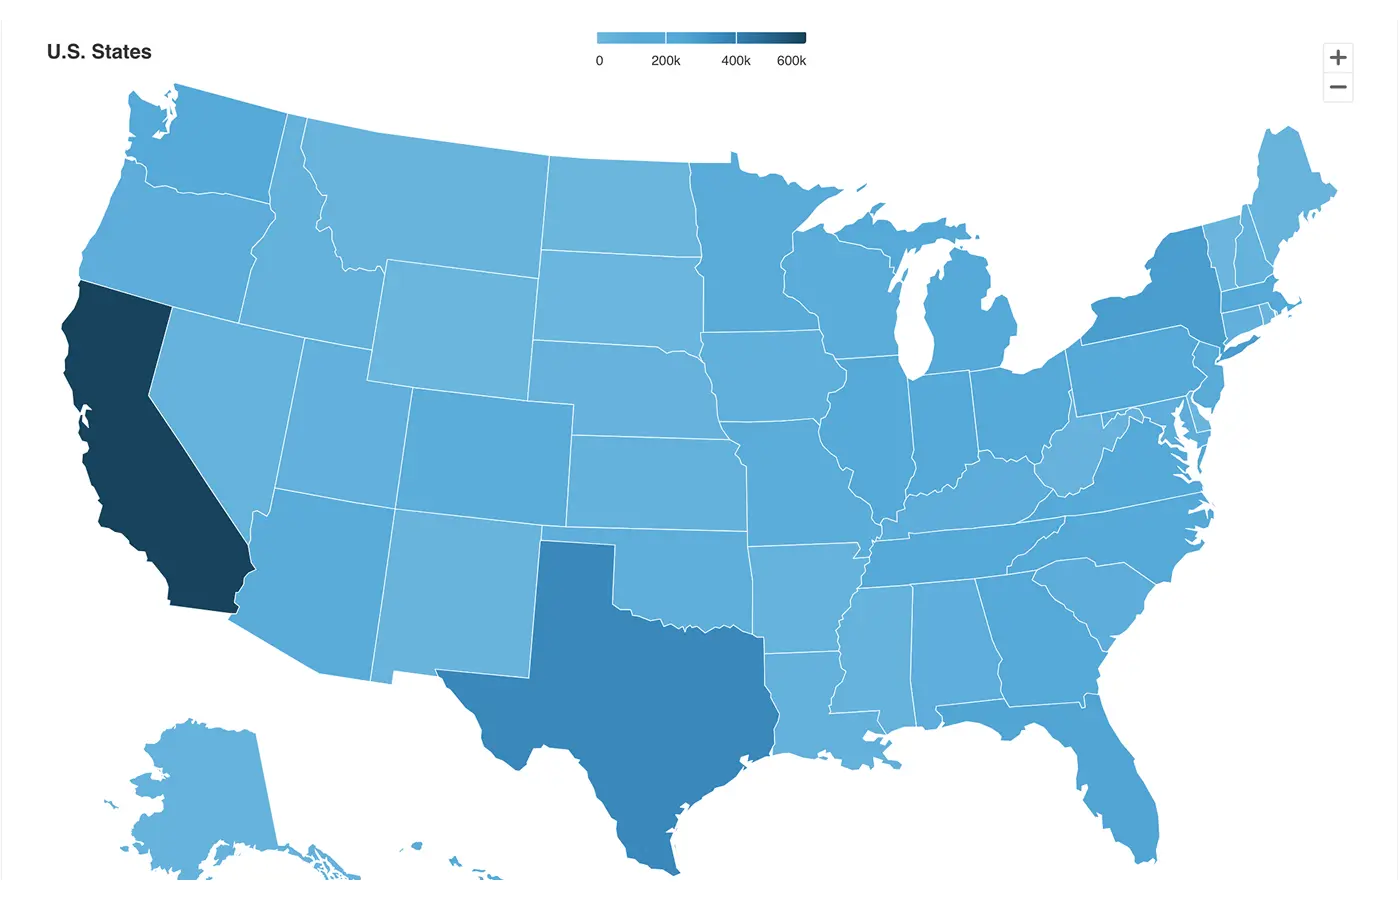
Precision Geo-Spatial Analytics
See your cost map, not just your delivery map.
State and county-level visualization of all spend, $/LB, and delivery volume, surfacing regional cost disparities you can't see in an aggregate report. Brands use it to decide where the next warehouse goes; 3PLs use it to advise clients on regional carrier utilization and final-mile routing.
Find out what your surcharges actually cost you.
Connect your carriers in minutes. Get your first full accessorial breakdown next week. Pay nothing.
Start Free – No Credit Card